BI 348 - Data Analysis with Microsoft Power Tools
Excel, Power Query, Spilled Arrays, PivotTables, Power Pivot, Power BI, Data Models, M Code, DAX and more!
BI 348 - Data Analysis with Microsoft Power Tools
Excel, Power Query, Spilled Arrays, PivotTables, Power Pivot, Power BI, Data Models, M Code, DAX and more!
Class Content (Videos, Excel Files, PDF Note Files, Test Files):
Week 1:
Video to watch:
MS
365 Excel Basics 08: PivotTables, Slicers, Charts, Conditional Formatting,
Data Analysis Tips! (36
mins)
Excel File Download: ExcelBasics08.xlsx (1 practice problem at end of worksheets)
pdf notes: ExcelBasics08.pdf
Download Excel workbook project for the Excel Basics 08 video: BI348Project01.xlsx . When you complete the Excel file project, you can upload it to the Home area of our Canvas course.
Week 2:
Video to watch:
MS 365 Excel Basics
09: PIVOTBY & GROUPBY Functions Beat PivotTable: 10 Mind-Blowing Examples! (51
mins)
Excel File Download: ExcelBasics09.xlsx (5 practice problem at end of worksheets)
pdf notes: ExcelBasics09.pdf
Download Excel workbook project for the Excel Basics 09 video: BI348Project02.xlsx . When you complete the Excel file project, you can upload it to the Home area of our Canvas course.
Week 3 (4 videos):
Video to watch:
MS 365 Excel Basics
10: Power Query, FlashFill, XLOOKUP, PivotTables Sort & Filter! 7 DA
Examples. (1 hour 22 mins)
Video to watch:
MS 365 Excel Basics #10 Part 02: SORT
Array Function (5 mins)
Video to watch:
MS 365 Excel Basics #10 Part 03: FILTER Array
Function (4 mins)
Video to watch:
MS 365 Excel Basics #10 Part 04: GROUPBY Array
Function to Calculate the Percent of Count Total (3
mins)
Download zipped folder with all files: MECS04DownloadFiles.zip (after you download, unzip to get access to files)
pdf notes: inside zipped folder
Download Excel workbook project and the data files for the Excel Basics 10 videos:
BI348Project03.xlsx
Project03Problem03HourlyWageTextFiles.zip
Projetc03-Problem02-TreeData.csv (right-click to download)
When you complete the Excel file project, you can upload it to the Home area of our Canvas course.
Week 4 (2 videos):
Video to watch:
MS 365 Excel Basics
11: Power Pivot, Data Model, Relationships & DAX Measures, & Filter Context
Too! (40
mins)
Video to watch:
MS 365 Excel Basics
12: Power BI Desktop & Interactive Visuals / Dashboards, Import Excel Data
Model 25
mins)
Download zipped folder with all files: MECS04DownloadFiles.zip (after you download, unzip to get access to files)
pdf notes: inside zipped folder
Download the pdf project instructions and the zipped folder with project files for the Excel Basics 11 & 12 videos:
BI348Project04Instructions.pdf (right-click to download)
When you complete project 4, you can upload your results (two files) in the Home area of our Canvas course.
Week 5:
Video to watch:
MS 365 Excel Basics
#13: Power BI Dashboard from 7 Million Rows of SQL Data and DAX Formulas
(45
mins)
Download zipped folder with all files: MECS04DownloadFiles.zip (after you download, unzip to get access to files)
pdf notes: inside zipped folder
Download .Project 5 Excel file for this Excel Basics 13 video: BI348Project05.xlsx
When you complete project 5, you will upload your results in the Home area of our Canvas course.
Dear Team,
We just finished the Excel Basics Data Analysis videos
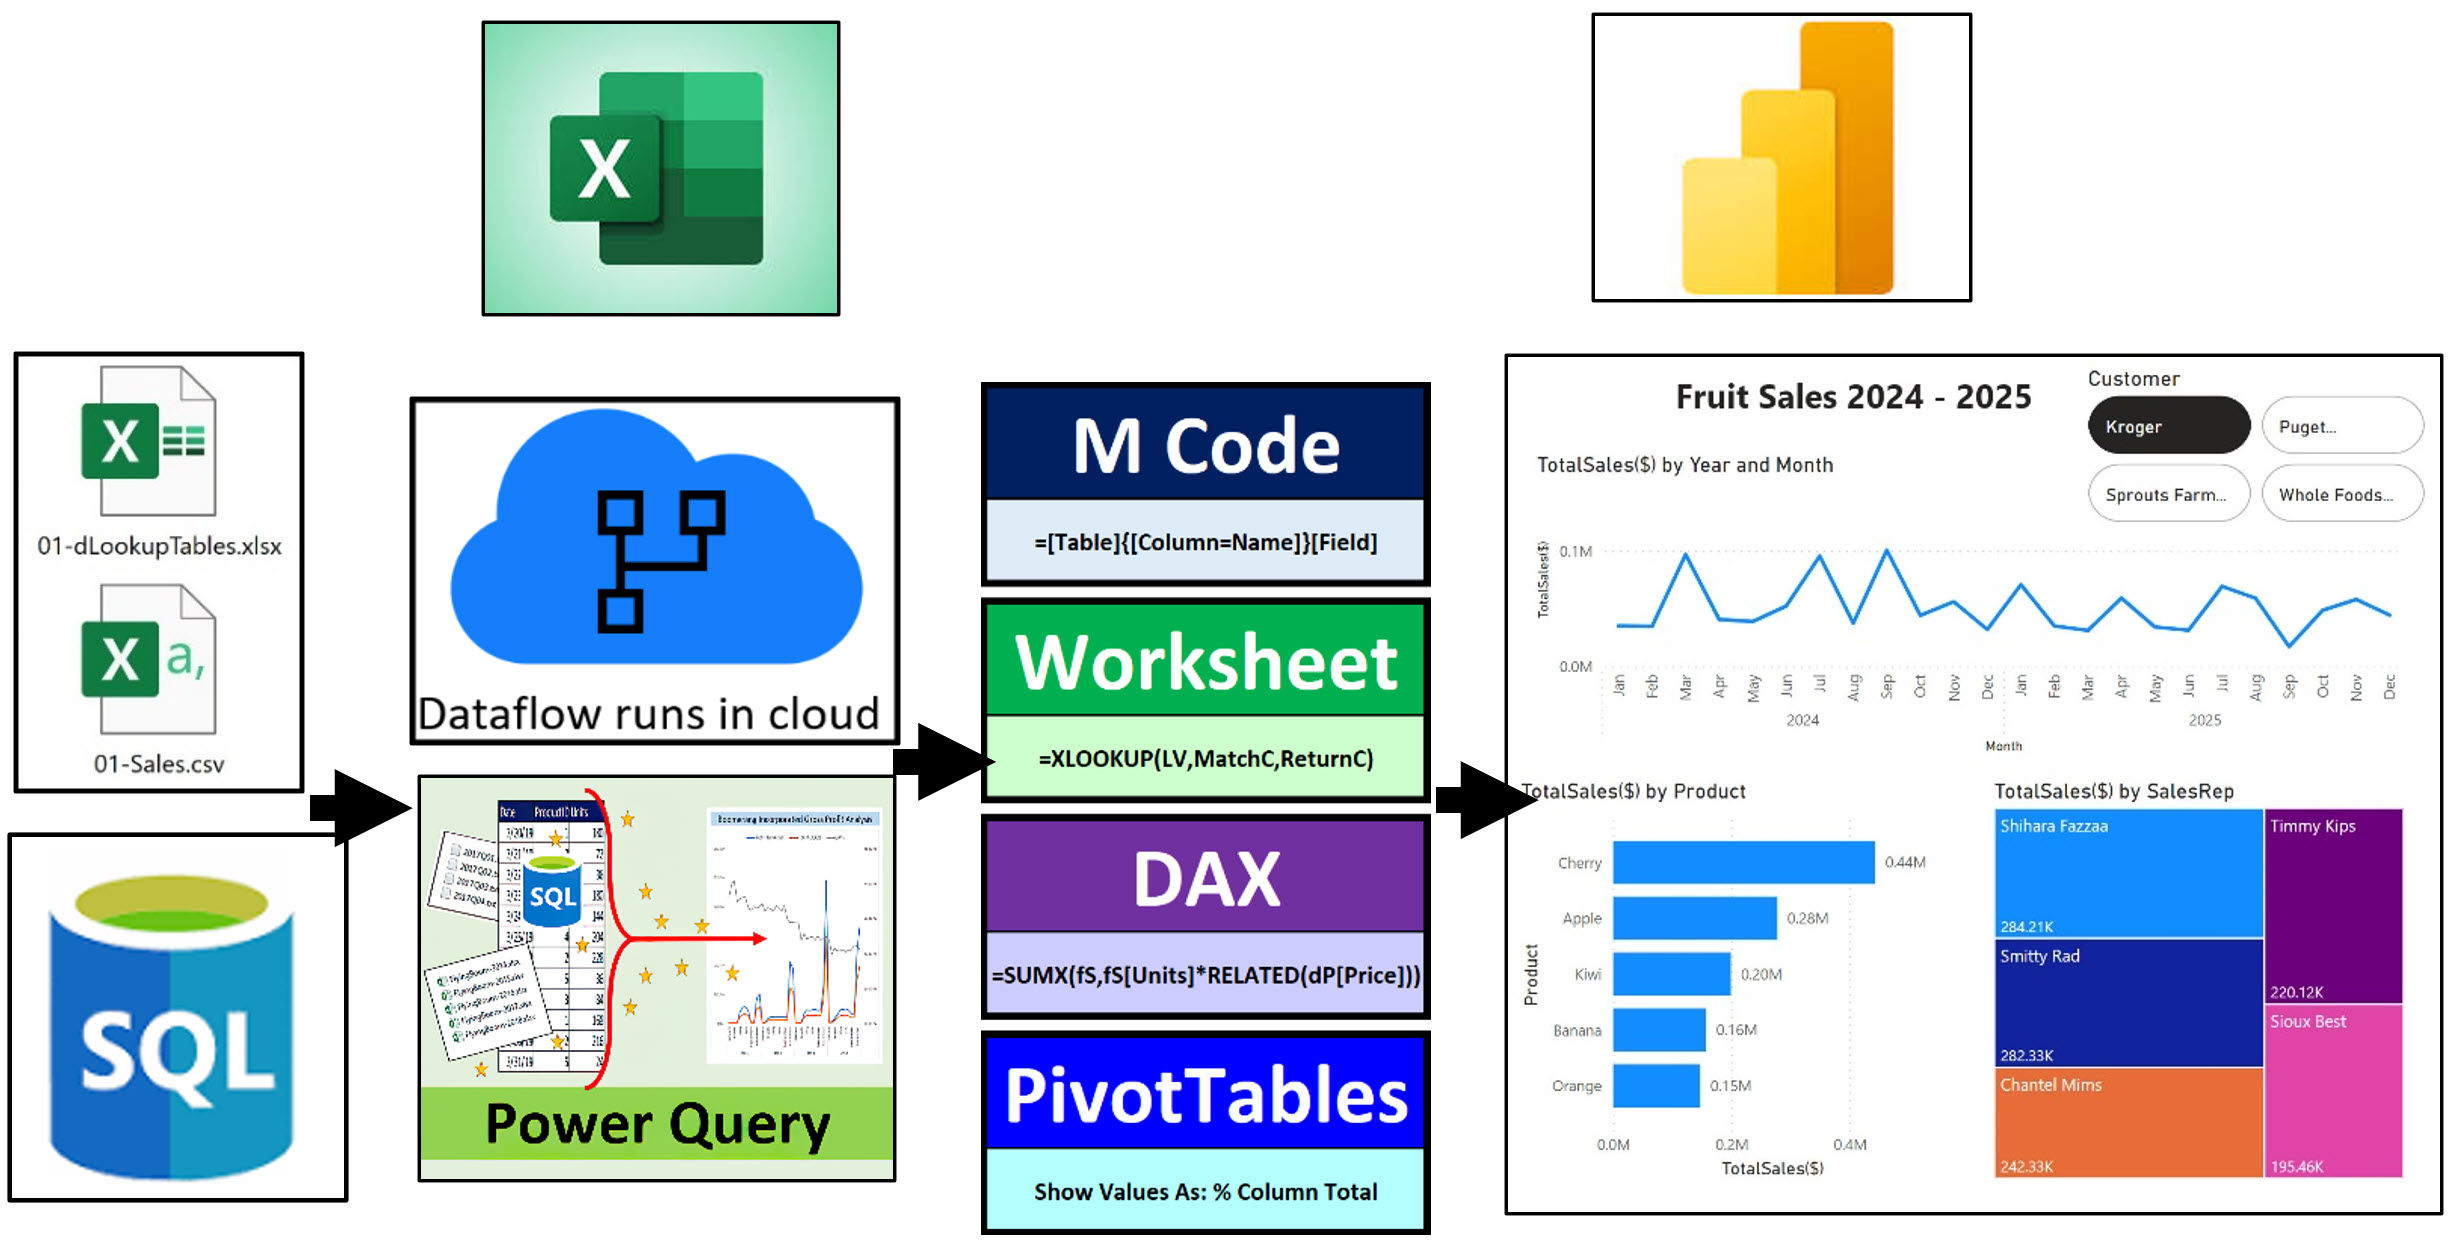
and files. This means that we have covered all the Microsoft Power Tools for
Data Analysis such as: Worksheet Formulas & Functions & Features,
PivotTables, Power Query, Power Pivot, Power BI Desktop, DAX formulas and
even had a peak at Power Query’s formula language: M Code.
Now we are on to a new Advanced Microsoft Power Tools
for Data Analysis video class that I created called: Data Analysis Made Easy
With Microsoft Power Tools, or just DAME. This video class will cover some
of the same topics that we studied in the first half of the class, but at a
more advanced level that more accurately reflects the terms, terminology,
and data modeling concepts from the working word. We will also spend a lot
of time studying the Functional languages DAX (Data Model) and M Code (Power
Query). The two functional languages are totally different than the
worksheet formula and function language, but as we will learn, this is
because each functional language has its own super power that it brings into
our data analysis toolkit : )
I filmed The DAME videos last year for our BI 348
class, when Highline provided Power BI Online Licenses. We do not have those
licenses for this Spring 2025 quarter and so we cannot practice any of the
online data analysis Microsoft tools that I show in the videos such as:
1.
Power BI Online, this is where we can publish
Power BI Desktop files so we can share and work online.
2.
Data Flow, which is Power Query Online.
The fact that we do not have licenses DOES NOT MATTER
AT ALL. Why? Because the online versions of Power BI Desktop and Power Query
use the EXACT same tools that we use in the offline versions. This means
that all the data transforming, data modeling, reporting and visualizing
skills that you learn offline, can be used in the online environment if or
when you work for an entity that uses the online versions. While you are
studying the DAME videos for this class, if you want to watch the examples I
show of the online versions, you can do that. If you want to skip them, you
can.
Also, last year when I filmed the DAME videos, the
GROUPBY and PIVOTBY functions were still in beta, and so I had to show how
to create reports with functions like UNIQUE and SUMIFS. However, I did show
the amazing GROUPBY and PIVOTBY functions but said in the video that they
are not available yet. As you know, they are available, and we have already
studied them! If you want to skip those parts in the videos, you can.
Alright then, on to more fun with Microsoft Data
Analysis Power Tools in this DAM video class!
Go Team!!!
Sincerely, Michael Girvin
Week 6 & 7:
Video to watch:
DAME 01: Data Analysis Terms & the Awesome Microsoft Power Tools!
(25 mins)
**For DAME video #2, you only need to
watch 00 to 01:33:56 time mark. Everything after 01:33:56 requires a Power
BI Licence which we do not have for this class.
Video to watch:
DAME 2: MS Data Analysis Tools: Excel, Power Query, Power BI, Data
Flow, DAX & M Code!
Download zipped folder with all files for video 1 & 2: Video01-02Files.zip
pdf notes in zipped folder
There are three projects for you to complete and upload in the Home Area of Canvas before Monday, May 19.
Project 6:
Download files, rename files so your name is part of the file name, follow instructions in Excel file:
Excel file: YourNameProject06.xlsx
Source Data Json file: YourNameProject06FactTable.json
Project 7:
Download project instructions (pdf file) and the source data tables. Follow pdf instructions to complete project.
Pdf instructions: Project07Instructions.pdf
Source data files:
xml fact table: YourNameProject07fSales.xml
Excel file with dimension tables: YourNameProject07DimensionTables.xlsx
Project 8:
Project Excel File: YourNameProject08.xlsx
Source data files:
csv fact table: YourNameProject08EssentialBakingSales.csv
Excel file with dimension tables: YourNameProject08DimensionTables.xlsx
Week 8:
Video to watch:
DAME 05: Master Power Query M Code & Become a Data Shaping Ninja
(The Secret Behind Data Analysis)
(1 hour 50 mins)
In this video there are two start files: 05-DAMEMPTStart.xlsx and 05-DAMEMPTStart.pbix . Becasue Power Query is in both Excel and Power BI Desktop, you can use either file to practice writing M Code while following along with the video. In addition, there is no separate project to hand in for points toward your grade. To get points toward your grade you can pick one of the start files, add your name to the start file file name, complete everything that is shown in the video, and then upload it to the Home area in Canvas.
Download zipped folder with all files for video: DAMEwithMPT05.zip
pdf notes in zipped folder.
Week 9:
Video to watch:
DAME 06: DAX Fundamentals in Power BI & Power Pivot
(2 hours 30 minutes)
In this video there are two start files: 17-M365ExcelClassStart.xlsx and 17-M365ExcelClassStart.pbix. Becasue DAX formulas are in both the Excel and Power BI Desktop Data Model, you can use either file to practice writing M Code while following along with the video. In addition, there is no separate project to hand in for points toward your grade. To get points toward your grade you can pick one of the start files, add your name to the start file file name, complete everything that is shown in the video, and then upload it to the Home area in Canvas.
Download zipped folder with all files for video: DAMEwithMPT06.zip
pdf notes in zipped folder.
Week 10:
Video to watch:
DAME 07: How to Make Effective Dashboard. Three Examples in Power BI
(35 minutes)
In this video there are three start files: 01-AveDailySales-Start.pbix and 02-GradeAnalysis-Start.pbix and 03-YOY-Dashboard-Start.pbix. You create a different dashboard in each one. In addition, there is no separate project to hand in for points toward your grade. To get points toward your grade you complete the three dashboards and then upload the three Power BI Desktop files to the Home area in Canvas.
Download zipped folder with all files for video: DAMEwithMPT07.zip
pdf notes in zipped folder.
Link to Old BI 348 Class 2024
Link to Old BI 348 Class 2023
Link to Old BI 348 Class 2022:
Link to Old BI 348 Class 2020
Link to Old BI 348 Class 2019
Link to Old BI 348 Class 2015-2018
.