

Highline College BI
348:
Videos & Files & Handouts & Assignments by Week:
Note: In this class we create a lot of PivotTables. Microsoft recently changed the dialog box for creating a PivotTable. This video shows the new dialog box and data connectors when you create a PivotTable. Most of you will not see this new feature yet, but in case Microsoft pushes this new feature out, I made a video about it. The dialog box is not that much different, and most of us would figure out how to create our PivotTable with the new dialog box, but I figured I should make a video about it:
Video link: 4 New Create PivotTable Dialog Boxes: 4 Amazing Data Sources. Excel Magic Trick 1729. (07:07 mins)
Week 1 - 2:
Story behind this week’s videos and project: This was a consulting job from a client in India who
needed a cross tabulated report to Count Work Hours Less Than Zero by Name,
Description, for Each Month, for the filed Disposition where the condition
was "TimeIn". This client wanted to use Excel worksheet formulas. So, I
showed him how to create the report with the COUNTIFS function. However, the
formula was very complicated. I then showed him how to do it in an easier
way, first, with a PivotTable and then, second, if the data was external to
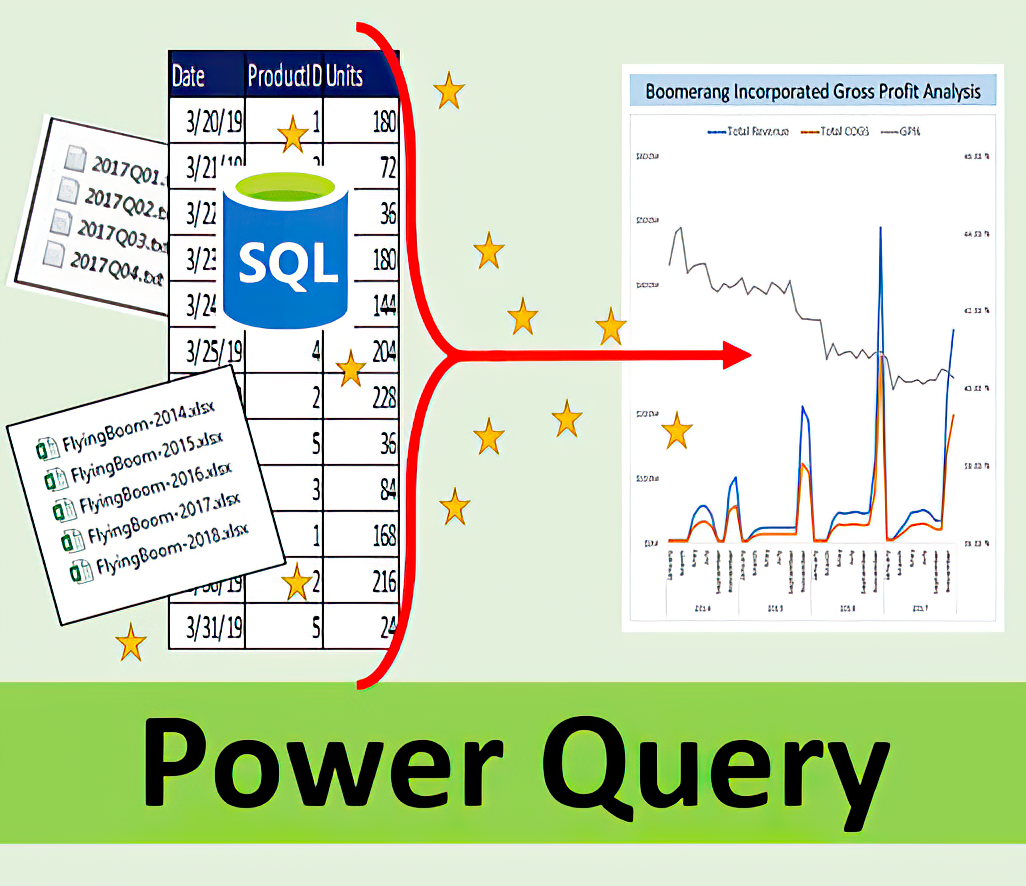
the Excel workbook, with Power Query and a PivotTable. The below videos show
the three methods. The project for this week 1-2 section of the class
requires that you create a similar cross tabulated report using 1) a
PivotTable and then 2) Power Query and a PivotTable. If you want extra
credit, you can create the report a third way using worksheet formulas. But
this is not required.
Videos to watch:
01: COUNTIFS 6 Criteria Counting Cross Tab Report. Change Cell Reference Every 3 Columns Too! EMT 1656 (11:33 mins)
02: PivotTables Are Easy: 6 Criteria Cross Tabulated Counting Report. Excel Magic Trick 1657 (05:34 mins)
03: Power Query & PivotTable Work Together! 6 Criteria Cross Tabulated Counting Report. EMT 1658 (09:55 mins)
04: Excel Power Query DataSource.NotFound: File or Folder: We couldn't find the folder. Solved! EMT 1662 (01:00 mins)
Files to download so that you can follow along with videos and practice what you see:
Download Excel Start File:
https://people.highline.edu/mgirvin/YouTubeExcelIsFun/EMT1656-1658Start.xlsx
Download Text Files for 1658:
https://people.highline.edu/mgirvin/YouTubeExcelIsFun/1658TextFiles.zip
Download Excel File with Finished Examples:
https://people.highline.edu/mgirvin/YouTubeExcelIsFun/EMT1656-1658Finished.xlsx
Project to complete and upload to Project 1 upload link in Home Area, Week 1-2 section in Canvas:
Excel File and Instructions: Project1.xlsm
Text Files Need for Project (3 text files in zipped folder): Project01CSVTextFiles.zip
Project 1 due before midnight on April 17 (be sure to have your name in the file name when you upload it to Canvas)
Week 3:
Story behind this week’s videos and project: A client asked about the different ways to calculate gross profit and the percent of gross profit with a PivotTable. This was an interesting question because the percent of gross profit calculation cannot be done as a helper column in the revenue table. This means that you have to get creative with building formulas inside the PivotTable. There is just one video to watch for this section. The video shows three methods to solve this problem. The project for this week will require that you use two of the methods for calculating gross profit.
Videos to watch:
01: PivotTable Formulas? Calculated Field, DAX Formula or Excel Table Formula for Gross Profit? EMT 1730 (12:16 mins)
Files to download so that you can follow along with videos and practice what you see:
Download Excel File: https://excelisfun.net/files/EMT1730.xlsx
Download Excel File with Finished Examples: https://excelisfun.net/files/EMT1730CompletedFormulas.xlsx
Project to complete and upload to Project 2 upload link in Home Area, Week 3 section in Canvas:
Excel File and Instructions: Project2.xlsm
Text File (1 file with 900,000 rows of data) Need for Project: FlyingBoom-2020.csv
Project 2 due before midnight on Sunday, April 24 (be sure to have your name in the file name when you upload it to Canvas)
Week 4:
Story behind this week’s videos and project: A number of clients needed to append multiple tables into one table. One, had trouble because a particular field in a table would not append, but instead it should up as 4 different columns!?! The two videos for this week show how to append and how to deal with issues like fields not appending. The project for this week will require that you append all the Excel Tables in the workbook and then create a PivotTable Report.
Videos to watch:
01: Power Query Append / Combine Tables: 3 Amazing Methods. Excel Magic Trick #1714 ( 13:08 mins)
02: Repeat Columns in my Power Query Append?? Too Many Columns? Extra Columns? EMT 1623 ( 08:03 mins)
Files to download so that you can follow along with videos and practice what you see:
Download Excel Files to practice for Method #1 and #3: https://excelisfun.net/files/EMT1714.xlsx
Download Excel Files to practice for Method #2: https://excelisfun.net/files/EMT1714-ExcelCurrentAnswer.xlsx
Download Excel File with Finished examples for Method 1 and Method 3: https://excelisfun.net/files/EMT1714Answer.xlsx
Download Excel File with Finished examples for Method 2: https://excelisfun.net/files/EMT1714-ExcelCurrent.xlsx
Zipped Folder with Grade Tables: https://excelisfun.net/files/EMT1714GradeTables.zip
Download Start Excel File: https://excelisfun.net/files/EMT1623Start.xlsx
Download Excel File with Finished examples: https://people.highline.edu/mgirvin/YouTubeExcelIsFun/EMT1623Finished.xlsx
Project to complete and upload to Project 3 upload link in Home Area, Week 4 section in Canvas:
Excel File and Instructions: Project3.xlsm
Project 3 due before midnight on Sunday, May 1 (be sure to have your name in the file name when you upload it to Canvas)
Week 5 - 6:
Story behind this section’s videos and project: A fellow Highline College professor asked how to create a unique list of student names from a given Canvas classroom and then show the last date-time that the student accessed the class web site. I have had other clients who needed to find the last data a customer made a purchase and the last price posted in a price list. In all cases, the key is to find the maximum date. The below two videos show how to do it with a PivotTable and then how to do it with Power Query. This sort of report to show the last date is very common. The project will require you to find the last data that a customer made a purchase using a small data set and then you will have to download a large data set from a City of Seattle web site and build a report that shows the last data that a particular 911 type of call was made for each year.
Videos to watch:
01: List Students Last Access Date & Time for Class Web Site with PivotTable. Excel Magic Trick 1688 ( 04:46 mins)
02: Power Query to List Students Last Access Date & Time for Class Web Site. Excel Magic Trick 1689. ( 06:58 mins)
Files to download so that you can follow along with videos and practice what you see:
Download Excel File: https://excelisfun.net/files/EMT1687-1689.xlsx
Download csv file #1: https://excelisfun.net/files/EMT1689-TextData.csv
Download csv file #2: https://excelisfun.net/files/EMT1689-TextData2.csv
Project to complete and upload to Project 4 upload link in Home Area, Week 5-6 section in Canvas:
Excel File and Instructions: Project4.xlsm
Project 4 due before midnight on Sunday, May 15 (be sure to have your name in the file name when you upload it to Canvas)
Week 7 - 8:
Story behind this section: There will be a total of 5 videos with a total length of about 4 hours for weeks 7-8 and weeks 9-10. These 5 videos will be a complete set of lessons about all the Microsoft Power Data Analysis tools. Some of the content will be review for you, but some of it will be new. The intent is to give you a full overview of all of Microsoft Power Data Analysis tools for performing data analysis in this last class in the series of classes: Busn 216, Busn 218, Busn 210 and BI 348. It will be a good 5 video over view of all the data skills you will need after you graduate and get jobs with your Global Trade and Logistics degree.
Videos to watch:
00: Data Analysis Class: Intro to PivotTable, Power Query, Power Pivot, Power BI & Big Data (05:29 min)
01: Excel Data Analysis Class 01: PivotTables, Power Query, Formulas and Charts (36:03 min)
Files to download so that you can follow along with videos and practice what you see:
Download Start Excel File:
https://excelisfun.net/files/EDA01-Start.xlsx
Download Excel File with Finished examples:
https://excelisfun.net/files/EDA01-FinishedAfterVideoFilmed.xlsx
Download Text Files:
https://excelisfun.net/files/fSales.txt
Download Text Files:
https://excelisfun.net/files/fSales-WithExtraYearData.txt
Video to watch:
02: Excel Data Analysis Class 02: Power Pivot, DAX Formulas, Relationships, Data Modeling & Much More! (01 hours and 16:24 min)
Files to download so that you can follow along with videos and practice what you see:
Download Start Excel File:
https://excelisfun.net/files/EDA02-Start.xlsx
Download Excel File with Finished examples:
https://excelisfun.net/files/EDA02-FinishedAfterVideoFilmed.xlsx
Download Text Files:
https://excelisfun.net/files/EDA-02-CSVFiles.zip
Download Power BI Desktop File with
Finished example:
https://excelisfun.net/files/EDA02-PowerPivotImport.pbix
Project to complete and upload to Project 5 upload link in Home Area, Week 7-8 section in Canvas:
Excel File and Instructions: Project5.xlsm
Text File (1 file with 1
million rows of data) Need for Project: fSalesProject5.csv
Project 5 due before midnight on Sunday, May 29 (be sure to have your name in the file name when you upload it to Canvas)
Week 9 - 10
Story behind this section: this is a continaution from weeks 7-8 section : )
You will have to download and install the free Microsoft Power BI Desktop app. The video shows links. You can start watching video and download after you watch the introduction, if you want. The link to download is also here: Download free Power BI Desktop:https://powerbi.microsoft.com/en-us/desktop/
Video to watch:
03: Excel Data Analysis Class 03: Power BI Desktop, DAX Formulas, Relationships, Data Modeling& Visuals ( 01 hours and 16:12 min)
Files to download so that you can follow along with videos and practice what you see:
Download Text Files:
Download Power BI Desktop File with
Finished examples:
Video to watch:
04: Excel Data Analysis Class 04: BIG Data Analysis with Power Pivot & Power BI: Visuals & DAX Formulas ( 58 min)
Files to download so that you can follow along with videos and practice what you see:
Download Power BI Desktop Chapter 3
Finished File with DAX Date Table Code:
https://excelisfun.net/files/EDA03-Reports-FinishedAfterVideoFilmed.pbix
Download Power BI Desktop File with
Finished examples:
https://excelisfun.net/files/EDA04-ReportsFinished.pbix
Download Start Excel File:
https://excelisfun.net/files/EDA04-Start.xlsx
Download Excel File with Finished examples:
https://excelisfun.net/files/EDA04-Finished.xlsx
Project to complete and upload to Project 6 upload link in Home Area, Week 9-10 section in Canvas:
Project Instructions:
BI 348
Project 6.pdf (right-click to download)
Project Text File:
Code_Complaints_and_Violations.csv (right-click to download)
Project 6 due before midnight on Sunday, June 12 (be sure to have your name in the file name when you upload it to Canvas)
Old Class #1 (2015-2018): Statistics Based Version: BI 348 - 1
Old Class #2 (2019): Microsoft Big Data with MS Tools Version: BI 348 - 2 ...
Old Class #3 (2020): Microsoft Big Data with MS Tools Version: BI 348 - 3 ...