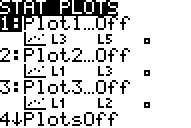
To see STAT PLOT, press 2nd and then Y=. You should get something like:

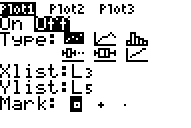
When doing simple data analysis problems, we only use Plot1 and Plot2. To see the options for Plot1, press ENTER. You will get a screen like:

There are five options:
a.) On/Off (more here). It must be On for the data to be graphed.
b.) Type (in this case a scatterplot). Only rarely will you need any other
option.
c.) Xlist
d.) Ylist
e.) Mark. This is simply a matter of preference.
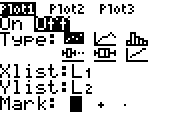
We want to plot L1 vs. L2. So, move the cursor over the L3 and then press 2nd followed by 1. Then move the cursor over L5 and press 2nd followed by 2. This should give you:
 (Ignore the black option for Mark).
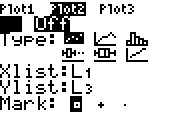
Now move to the top and select Plot2.
Set Plot2 to graph L1 vs. L3. It should now look like:

Your STAT PLOT is now set correctly.
last modified September 05, 2007