To see the Y=, press Y= (upper left).
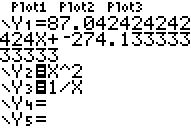
Another type of calculator clutter is a messy looking Y=. For example, consider:

Note: The "=" next to Y2 and Y3 are highlighted while the one next to Y1 is not. Only functions with highlighted "=" are active and will be graphed. To activate or inactivate, move your cursor over the "=" and then press ENTER.
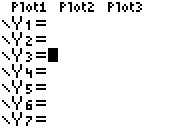
You must clear the functions individually by moving your cursor to the line and then pressing CLEAR.
Your Y= should now look like:

Note: If your Plot1, Plot2, or Plot3 are highlighted and you don't want this, click here.
last modified December 16, 2010