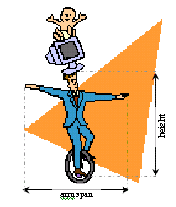
I wanted to give you a real life example to look at - one using real numbers. So, I went out and measured the height and arm span of a group of people.

| Height (ft' in") | Arm Span (ft' in") | |
| 1 | 5' 9" | 5' 10" |
| 2 | 5' 1.5" | 4' 10" |
| 3 | 4" 5" | 4' 4.5" |
| 4 | 5' 4" | 5' 3" |
| 5 | 4' 2" | 4' 3" |
| 6 | 5' 8" | 5' 7" |
| 7 | 6' 4.5" | 6' 1" |
| 8 | 6' 2" | 6' 3.5" |
| 9 | 5' 4" | 5' 6" |
| 10 | 3' 0" | 2' 11" |
| 11 | 2' 2" | 2' 1" |
| 12 | 5' 9.75" | 5' 10.5" |
| 13 | 6' 1" | 6' 3" |
In order to analyze this data, I need to convert it into inches.
| Height (in") | Arm Span (in") | |
| 1 | 69" | 70" |
| 2 | 61.5" | 58" |
| 3 | 53" | 52.5" |
| 4 | 64" | 63" |
| 5 | 50" | 51" |
| 6 | 68" | 67" |
| 7 | 76.5" | 73" |
| 8 | 74" | 75.5" |
| 9 | 64" | 66" |
| 10 | 36" | 35 |
| 11 | 26" | 25" |
| 12 | 69.75" | 70.5" |
| 13 | 73" | 75" |
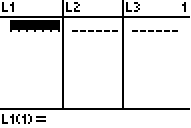
Beginning at the home screen, press STAT and then choose Edit (option 1). Assuming that you already cleared your lists (how), you should be looking at a screen like this:

Enter the the heights in L1 and the arm spans in L2. L1 will almost always be our independent variable (think of x) and L2 will almost always be the dependent variable (think of y).
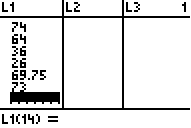
To enter the heights above, type 69, ENTER, 61.5, ENTER, ..., 73, ENTER. Your screen should now look like: (Note: L1(14) means that the highlighted cell is the 14th in L1).

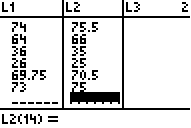
Now, hit the right arrow which will bring you to the top of L2. Then enter that data: 70, 58, ..., 75. You should now have:

If you enter the data incorrectly, you will have problems. Two commonly made errors are: a.) forget a data point in one list. You know you have this problem if your lists are not the same length (in this case 13). b.) A second common error is to incorrectly type in a number. You can usually catch this error later on when you graph the data - if your graph does not look like you think it should, then check your data set.
last modified December 16, 2010